Agile Elephant making sense of digital transformation

innovation | digital transformation | value creation | (r)evoloution

  • Email
  • Facebook
  • Google+
  • LinkedIn
  • Twitter
  • Home
  • Manifesto
  • Services
    • Our Approach
    • Our Services
    • Making Collaboration Work Packages
    • Collaboration Solutions
    • Our Experience
    • Workshops
    • Innovation
  • About Us
    • The Team
    • Why we do what we do
    • Why are we called Agile Elephant?
    • Our Partners
    • Our Clients
  • Get Involved
    • Events
    • Meetups
    • Unconference
    • Newsletter
  • Resources
    • What is Digital Transformation?
    • What is the Digital Enterprise Wave?
    • Our Research
    • Case Studies
    • People We Follow
    • Articles & Links
    • Books That Inspire
  • Blog
  • Contact Us
Home Archives for HR
Employee Engagement :  The New Heart of Enterprise 2.0?

February 17, 2014 By Janet Parkinson

Employee Engagement : The New Heart of Enterprise 2.0?

‘7 out of 10 of your colleagues don’t give a sh*t about your company.  The biggest problem is employee engagement”  Luis Suarez at the Enterprise 2.0 Summit, Paris 2014

Luis was using figures from this Gallup survey which highlights how only 13% of employees worldwide are engaged at work. He’s right – but why is this?  You only have to look at the rise in volume of Google searches for the term over the last 5 years to see just what a buzzword ’employee engagement’ it is becoming, and it does lie at the heart of  the Social Business / Business Transformation / Enterprise 2.0 ethos – so why the poor figures?

There has been so much research produced over the years showing that employee engagement really does help the bottom line that no one can deny that benefits really do exist.  Take just one set of results by Gallup of meta-analysis of 1.4 million employees which shows that organizations with a high level of engagement do report 22% higher productivity, and Harvard Business Research which states:

‘strong employee engagement promotes a variety of outcomes that are good for employees and customers. For instance, highly engaged organizations have double the rate of success of lower engaged organizations. Comparing top-quartile companies to bottom-quartile companies, the engagement factor becomes very noticeable. For example, top-quartile firms have lower absenteeism and turnover. Specifically, high-turnover organizations report 25% lower turnover, and low-turnover organizations report 65% lower turnover.”

Social tools have been shown to be some of the most powerful enablers of employee engagement over the last few years as reports by McKinsey have shown.

Yet it seems that only now companies are catching up with the technology and beginning to take on board the true power of the social tools available to them. Having spent the last 5 years or so adapting their external marketing mix to absorb the power of social media, they are beginning to realise the full potential of internal social tools which are speeding up business processes and breaking down silos allowing employees to collaborate more effectively and at greater speeds.  Happier employees providing customer service support really does produce better customer service results. Companies now realise that with social tools which run in realtime they cannot remain hidden behind a wall.  They therefore no longer have the option to ignore it – employee engagement is about to hit big time.

As Luis notes in the interview below it is only in the last 2 years that we are beginning to hear more about behavior and how to influence mindsets rather than just hearing about the social tools.  “We are not there yet…  but now that we are talking about behavior we will begin to see a massive shift in the way that employees are engaged in the work that they do”.

It was great to see though that employee engagement appeared as a key component of the Summit (which was after all traditionally a technology conference).  Yet it was right up front with both headliners. Dan Pontefract of Telus stated:

  • It’s not the tools it’s the behaviour
  • Engagement is a big driver of profitability which in turn is driving HR activity now
  • You can tie engagement to KPI drivers

and Jon Mell of IBM who noted:

  • Employee engagement drives customer satisfaction which drives profits
  • There are analytics now behind employee engagement which are key to the whole process, from interview questions to the proactive retention of the best employees
  • HR now has a seat at the table and has the power.

Many of the case studies touched upon engagement – though more often in terms of collaboration than specifically in terms of engagement.

Emanuele Quinterelli of Ernst & Young noted how in a survey of 300 Italian firms:

  • Currently the laggards tend to have no one in charge of collaboration as such
  • 56% of laggards have virtually no budget for collaboration while the top performers have at least 100k Euros of yearly budget and use business metrics 3 times more
  • 50% of laggards have no measurement, though only 9% of leaders have measurement in place
  • Leaders are engaging employees to engage customers

Martin Risgaard Rasmussen described how Grundfoss have deployed a program of culture change called Global Working Culture – run by HR.

HR – the company leaders of the future?

Following on from Jon Mell’s remark there are others who agree that HR really does have a seat at the table and Mar.  Oracle president Mark Hurd last October called for HR to transform itself and start to lead and drive businesses:

‘I want HR to help me run the company, to help with insight that will allow me to make the key business decisions, which will help the company grow…  Over the next decade HR as a function needs to lead and drive the business rather than react to it… It’s going to have to drive it in a way that’s more complicated than anyone has ever experienced before…  Turning from a support function to a leadership function will be core to what HR does in the next decade”

But in addition to HR let’s not forget the role of community managers.  At the Summit Rachel Happe discussed how to drive engagement and adoption on social platforms.  “A Community Manager has to inspire, establish and normalize a behavior change, this drives ROI” she said in a recent interview.  Community managers do act as lynchpins to networks which are increasingly crucial to the whole social business process.  Their role can encompass not just the monitoring and enhancement of engagement right across a company but also can provide and evaluate what can work better for the success of engagement across the whole community.

Employee Engagement – The Vision

But perhaps the killer statement for me in terms of employee engagement came from a casual tweet by Luis on the second day of the Summit:

Screen Shot 2014-02-16 at 12.28.01

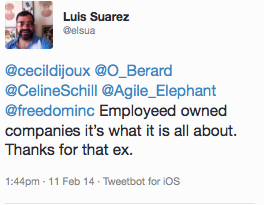
To truly engage employees to increase the performance and profitability of companies isn’t the ultimate deal to enable employees to own shares in the company?

Employee ownership is indeed on the rise:

“Employee ownership, where workers have a voice as well as a stake in the success of their business, is recognised as a sustainable business model which helps drive staff commitment, productivity, resilience and innovation.”  Real Business

And:

“Total return for shareholders in FTSE companies with employee share ownership rose by 53% in 2013, compared to 21% for companies in the FTSE All-share index, according to research by corporate finance firm Capital Strategies and the London Stock Exchange.” Employee Benefits

It’s becoming clearer that the way companies currently structure measurement and reward just isn’t working.  If you want employees to be truly engaged and really feel part of the big picture then treating them as cogs in the wheel and rewarding them for just being good cogs is never going to be enough.  Having a stake in the business will motivate them to take a business sized view.

Best of all it appears that Luis even has the UK government on his side…

 “Policy makers are increasingly embracing employee ownership as a key sustainable business model, and over the last 18 months we have seen a significant increase in support for this sector. In his budget in April this year (2013), George Osborne announced that, with effect from 2014, the Treasury would set aside £50m in tax reliefs for the employee ownership sector.  On top of this, in yesterday’s Autumn Statement George Osborne put the Government’s money where its mouth is, pledging a further £25m in support of this fast-growing sector of the UK…”  Real Business

Well, we’re not sure how many years we’ll have to wait for employee ownership to really take off and become the norm – but perhaps Luis should come over to London to give George a helping hand 😉

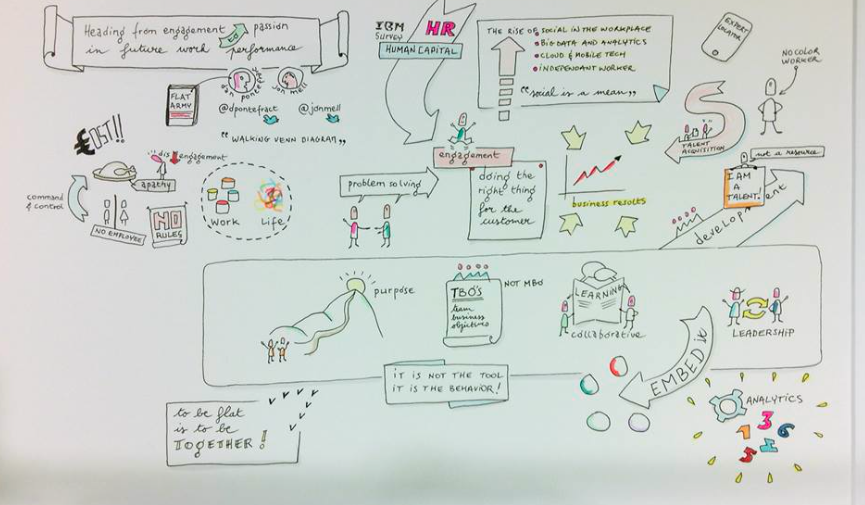
Image by Frederic Williquet: @fredericw : https://twitter.com/fredericw/media

Share this:

  • Tweet

Filed Under: business innovation, collaboration, employee engagement, enterprise 2.0, HR, social business, social tools

Jostling the hierarchy and the wirearchy

January 22, 2014 By David Terrar

Jostling the hierarchy and the wirearchy

cropped-wirearchy-600x2001As we’ve been setting up the Agile Elephant, and pulling together our manifesto for social business, we have been having a dialogue about a company’s hierarchy versus the wirearchy – the networked connections that happen inside and outside any company, crossing departmental boundaries, crossing company borders, and completely ignoring the organisation chart on the wall. Wirearchy is a concept coined by our Canadian friend and social business thought leader Jon Husband. It reflects the connected world that we now live in, and it highlights the changes that social technologies are enabling in the way we work. Jon’s working definition of wirearchy is “a dynamic two-way flow of power and authority, based on knowledge, trust, credibility and a focus on results, enabled by interconnected people and technology”. That definition and those key words resonate with us.

A few months back Jon introduced me to Brad Palmer, not for any specific reason, but just because he thought we were like minded and should be connected.  The wirearchy in action.  Brad’s another Canadian, and founder of Jostle.  Fast forward to this week and Brad was briefing the Agile Elephant team on what his social intranet platform can do. We’re interested in building up our knowledge of social business tools, and our first look made wirearchy jump in to our minds. Jostle has the most visual approach to showing the structures and networks that evolve in organizations that we’ve seen. Most collaboration products allow employees in the company to build up their profile so that you can understand key information, their skills and expertise and some of their work history. The good products will show you who works for whom. But we haven’t seen a product that shows the company’s org chart AND cross functional team structures as visually as Jostle, but it goes further than that.

Jostle logoThe company organization chart always come in for a lot of stick – soon after it’s up on the wall, the noticeboard or a Word document on the Intranet it’s out of date, not completely accurate, and in any case it doesn’t show the real organisation. What would happen if the chart was alive?  If the organisation chart was a living social network?  That’s what Jostle’s People Engagement® platform gives you.  Always up to date and showing the individual’s information with search and functionality to make it easy for others to connect to them based on skills and knowledge.  It shows the formal connections of the company hierarchy, but allows people to create ad hoc work groups.  They could be project teams, special interest groups, even social groups across and within an organisation.  Combined with Jostle’s library functions it offers the possibility for the Intranet to become a repository of learned knowledge, to help connect all that “unstructured” data sitting in Emails and ERP and Excel.  People can link easily and quickly across departments, the world and, most importantly, the business silos that grow up in even the smallest company, but are a real challenge to medium sized and larger enterprises.  Brad’s explanation showed us how the product would massively reduce the internal time taken in an organisation to find people, find information, and find answers.
A focus on employee engagement, as Jostle has done, has direct business benefits with good outcomes for both employees and customers. Look at this material on the Harvard Business Review blog.  Their findings show highly engaged organizations have double the rate of success of lower engaged organizations.  John Baldoni reports that:

“high-turnover organizations report 25% lower turnover, and low-turnover organizations report 65% lower turnover. Engagement also improves quality of work and health. For example, higher scoring business units report 48% fewer safety incidents; 41% fewer patient safety incidents; and 41% fewer quality incidents (defects).”

These kinds of social business platforms improve the efficiency of knowledge flow and decision making in any business. In an information business, this would have a major impact on business effectiveness – increasing efficiency as the transaction costs are lowered.  We believe there are great opportunities for companies to use Jostle and we’ll be exploring what it can do in the coming weeks and months.

Share this:

  • Tweet

Filed Under: collaboration, hierarchies, HR, leadership

Dunbar’s Numbers and Organising for Social Business

January 21, 2014 By Alan Patrick

Dunbar’s Numbers and Organising for Social Business

Dunbar’s  Number – a recap.

Robin Dunbar predicted that c 150 people demarcated the boundary of the number of personalised relationships we can have (Dunbar’s Number), by estimating when the amount of time required to keep a personal relationship going (the “transaction cost” of a personal relationship if you like) hits the wall of time available.  This number varies, some argue that it’s nearly double that of 150, but it’s of this approximate order of magnitude (and we suspect situation dependent on the transaction cost of keeping any one relationship going).  To précis Wikipedia:

Dunbar’s surveys of village and tribe sizes appeared to approximate his predicted value, including 150 as the estimated size of a Neolithic farming village; 150 as the splitting point of Hutterite settlements; 200 as the upper bound on the number of academics in a discipline’s sub-specialization; 150 as the basic unit size of professional armies in Roman antiquity and in modern times since the 16th century; and notions of appropriate company size (in pre-conglomerate days).

There are in fact a number of Dunbar’s Numbers

Dunbar actually theorizes there are a number of Dunbar Numbers, based on a series of boundary levels of social intimacy and acquaintance.  These levels reflect familiarity and emotional closeness, and each level has its own “cognitive constraints on sociality” (loosely speaking, how much you can constantly know about the people in the group).  His work came from looking at group sizes of hunter gatherer societies, past and present.  The levels he defines are broadly:

  • Core group – up to 5 people (family)
  • Close Group – c 15 people (close kinship group)
  • Acquaintance Group – c 50 people (band of related close kin groups)
  • Personal Social Group – c 150 people (bands of common lineage – typical size of a human small village through the ages, and what Dunbar believes is the biggest group of people one Human can have close personal relationships with)
  • Clan or similar organisational entity – c 450-500 people (cohesive sub tribal unit)
  • Tribal Group – c 1500 – 2000 people (a tribe)

Dunbar notes a geometric progression, “a factor of 3” applies to these larger and larger (but increasingly less intimate) social structures.  He was  looking mainly at fairly primitive human social structures, but he also believes that these group sizes have impacts on how we structure organisations and social network technology.

The Dunbar Number of 150 is not cast in stone, but forged in fire

Dunbar argues that 150 would be the mean group size only for communities with a very high incentive to remain together.  For a group of this size to remain cohesive, Dunbar speculated that as much as 42% of the group’s time would have to be devoted to social grooming.  Thus, only groups under intense survival pressure such as subsistence villages, nomadic tribes, and historical military groupings, have, on average, achieved the 150-member mark.  Moreover, Dunbar noted that such groups are almost always physically close: “… we might expect the upper limit on group size to depend on the degree of social dispersal.  In dispersed societies, individuals will meet less often and will thus be less familiar with each other, so group sizes should be smaller in consequence.”  Thus, the 150-member group would occur only because of absolute necessity—due to intense environmental and economic pressures.

Military Dunbar Numbers

Dunbar was not the only person to have made the observations of a “number of numbers” – others have noted for example that from ancient times onwards, armies have structured themselves in very similar sizes – look at modern infantry forces vs ancient ones:

  • c 5 troops – Fire team
  • c 10 – 15 men – Squad (Roman – 8 man, Greek File – 8 to 16 men)
  • c 30 – 40 men – Platoon (The basic Greek unit was 32 – 36 men, the basic Roman unit, the Century, was 60 – 80 men –  double the size – but was essentially split into two half centuries for command purposes)
  • c 120 – 150 men – Company (The Dunbar Number unit.  The Spartans used a 144 man basic formation, the Roman “Century” was 60-80 men but these were normally combined into pairs  (120 – 160 man Maniples)  in action)
  • c 450 – 600 men – Battalion (This size has been a standard size of the largest cohesive fighting formation from the earliest times, the Greek unit was 512 men, the main Roman unit (Cohort, Ala etc) stayed at roughly c 500 men size well into Byzantine times, a 2000 year stretch)
  • c 1500 – 2000 men – (3 – 4  Battalions) – a Regiment or Brigade in modern times – the largest Greek unit was c 1500 – 2000 men.  Roman Legions were c 5000 men, but interestingly the later Roman army split this down to Legiones of c 1,200 (c 2 as increasing responsiveness was required)

These basic structures have lasted thousands of years, under extremely testing conditions.  There is a lesson there.

There is another lesson from military structures too.  Over the period of the Industrial Revolution, as companies grew they needed to be larger, and needed larger structure models.  Business organisations were largely copied off contemporary  structured organisations of the 19th century, the hierarchical military of the time being foremost.  But no sooner was this done, than military organisation started to change.  The last 100 years has seen the pushing of command initiative down to smaller and smaller units.  The lesson came from the highly flexible Commandoes of the South African Boer armies,  but an eventual British victory meant it was swept under the carpet, and the big lesson of the war – that c 75,000 fast moving civilian farmers, in small units,  could only be beaten by half a million professional British Empire troops and guns – was ignored.  The first few years of the First World War showed the inflexible European tactics in all their stupidity, but from 1917 increasingly the initiative was being passed down from battalion to company level as new smaller unit tactics emerged.  This trend continued again into World War 2, which saw the arrival of smaller, independent and highly flexible structures like the Long Range Desert Group, Special Air Service, Marine Commandoes and Chindits.  By the end of World War 2 most armies were using highly flexible, high initiative small formations.  The many post WW2 asymmetric wars in the difficult terrains of Indo China, Africa and the Middle East showed that initiative and leadership had to go down even farther, until  units of 4 men were used as viable independent units.  A lot of this pressure has been forced by the need to react ever faster with fewer resources, and has been facilitated by more and more advanced communications technology.

That last sentence could describe the requirements of business, but what is ironic is that business organisations copied the armies of the wars of the early 1800s a and have been very slow to change, while military organisation has transformed radically.

Dunbar Numbers and Business Organisations

Dunbar also believes the “Dunbar numbers” have major impacts on Organisation design and structures, and on Social Network effectiveness.  Many others have noticed the same effect in organisation structures over the last century of course, a quick look at some bench research throws up the following lessons:

  • c 5 people – Agile software Task teams Team, Customer service cells, Work Cells from Japanese Lean Production experience – the optimum size to get stuff done where everyone can largely cover everyone else. Most businesses are between 1 and 5 people in nearly all countries
  • c 10 – 15 people – most Business Work Groups, Quality Circles, Delphi Technique groups all sit in this size band. Enough people to get sufficiently broad traction on a specific task, not too many to grind it down.
  • c 50 people – The largest group size where one person can know nearly everything that is going on in the group, and the group can collaborate with only a simple (or minimal) leadership hierarchy, run on a real time basis by one person or a small cadre.  Percy Barnevik of Asea Braun Boveri restructured a 200,000 person company into about 5000 units of c 40 people.   Richard Branson of Virgin thinks c 60 people is the right size for a team to remain flexible while still having a broad enough resource base to operate independently.
  • c 150 people – There is quite a lot of empirical support for c 150 people is the largest size at which a business can operate at a personal level, before structure (and silos) replace the  individual touch. Quite a few companies have found that independent units of a few hundred people are the most effective, from Dana Corporation in the 1970s to the Swedish tax office in the ‘Noughties. Many startups find that after about 150 people the company becomes more rigid and loses the initial spirit.  This is also commonly seen as about the largest size a business can get to under the typical “lead from the front” Founder-Entrepreneur team before a layer of meddle-management comes in.
  • c 500 people – Union Pacific restructured itself around units of 500 – 600 people.
  • c 1500 people – Most of the research shows that the larger businesses become increasingly inefficient, ineffective, and downright unpleasant places to work in.  The difficulty in the past is that, for a variety of reasons, forces have pushed businesses to expand to greater than optimum sizes.

The three main reasons that theorists point to, for this growth above optimum sizes, are (dis)economies of scale, transaction costs, and the agency problem.

  • Economies of scale arguments are essentially that even though the per unit efficiency goes down, the total output is still greater and creates lower per unit costs and market advantage. Also, the problems of scale (free riders, poorer communications, bureaucracy and so on) lag growth and so often don’t manifest themselves clearly until some time after the “optimum” size of organisation is surpassed.  A typical example of the diseconomy of scale effect is the Allen Curve, which shows communication in a business decreases exponentially as distance between workers grows
  • Transaction Costs – these are the costs of “getting something done”, first discussed in detail by Ronald Coase in the 1930’s. He noted that people begin to organise their production within firms when the transaction cost of coordinating production through the market exchange, given imperfect information (and high cost of transacting contracts), is greater than within the firm.
  • Agency Theory argues that the easiest thing senior managers (the agents of the business owners) can do to optimise their own reward is grow businesses turnover rather than ensure profitability or value, so they ensure they are rewarded for growth (especially for M&A deals, regardless of the typically negative value created), and thus the business is grown to ensure the rewards are pocketed.

Social Business & Dunbar’s Numbers

As noted, others have come up with similar observations of organisation sizings over the years, but Dunbar gives us a very hard-headed empirical set of metrics and a rationale for why it all works like it does, and that is very useful for understanding the impact of social technologies on business.  In short, we know that:

  • At each Dunbar’s Number level, a new level of social transaction frequency and intimacy is required – it’s not a hard break as a change of state
  • Each of these kevels represents different functional capabilities, from small team workgroup to larger and larger entities with less intimacy but greater sale, reach and flexibility
  • The number limit is set by the amount of social transaction time required to maintain each relationship at that level
  • Social Network technology cannot reduce the amount of time, but reduces the transaction costs of maintain each relationship over digital technology

This allows us to make two hypotheses for Dunbar’s Number in a Social Business world:

Firstly, the technology removes some of the transaction time, so in theory the Dunbar number can grow for any one of these groupings that makes heavy use of digital comms.  That means that a 6 person team is not going to see a huge benefit from social technology, buts a 150 person business spread across multiple locations is more likely to see benefits.  Either it can handle a % more people as well, or the same number of people more richly.  However, the state shift between these groups makes it very unlikely that the technology will allow a 150 person business to have the feel of a 50 person one – more that it can run to say 200 people before losing its 150 level Dunbar status.

Secondly, the transaction cost change makes it easier to keep up with people at a distance, as there is less “hassle” in dealing with them.  The Allen Curve showed that intimacy tends to drop with distance, even using technology – but that was before the current crop of “ambient presence” services.

We hypothesize that the current technologies will make it easier to integrate people working more remotely from each other.  It’s not a replacement for human face time – the increase in bandwidth between digital and face to face communication is orders of magnitude, not a linear increase – but it will make enough of a difference to allow market information, knowledge and decisions to flow through the organisation better than at the competition, which will make the enterprise faster and more likely to ” get it right” – and that, over several cycles, will start to create sustainable business advantage.

Update – been thinking about this post  from Janet Parkinson, and coming to the conclusion that if the Social Object is compelling enough, the Allen Curve can be over-ridden and thus the Dunbar Number can possibly be increased even though people are at a physical distance.  This will be the subject of the next post in this vein I think.


Share this:

  • Tweet

Filed Under: HR, social business, social tools, strategy

Sign up for our regular Agile Elephant Newsletter - news, posts, ideas and more.

My Tweets

From the Agile Elephant Blog

  • The Metaverse doesn’t exist yet, but…
  • Impossible Things get Disruptive
  • Clarity, Cloud, and Culture Change at IBM

What Next?
Take a look around our site, check out our approach, see how we can help, join the conversation on our blog or contact us to find out more.

About Us

Agile Elephant is a new kind of consultancy designed to help companies embrace the new digital culture of social collaboration, sharing and openness that is changing business models and the world of work.

Contact us to find out more!

Our founder's blogs:

broadstuff

@DT on Medium

Technotropolis

Our blog:

The Agile Elephant Blog

Site Log In | Site Log Out

Subscribe to Site RSS

Subscribe to our Blog via Email

Enter your email address to subscribe

Copyright © 2025 ·Streamline Pro Theme · Genesis Framework by StudioPress · WordPress · Log in