Agile Elephant making sense of digital transformation

innovation | digital transformation | value creation | (r)evoloution

  • Email
  • Facebook
  • Google+
  • LinkedIn
  • Twitter
  • Home
  • Manifesto
  • Services
    • Our Approach
    • Our Services
    • Making Collaboration Work Packages
    • Collaboration Solutions
    • Our Experience
    • Workshops
    • Innovation
  • About Us
    • The Team
    • Why we do what we do
    • Why are we called Agile Elephant?
    • Our Partners
    • Our Clients
  • Get Involved
    • Events
    • Meetups
    • Unconference
    • Newsletter
  • Resources
    • What is Digital Transformation?
    • What is the Digital Enterprise Wave?
    • Our Research
    • Case Studies
    • People We Follow
    • Articles & Links
    • Books That Inspire
  • Blog
  • Contact Us
Home Archives for Alan Patrick
McKinsey technology impact on business and Social Business’s role

January 30, 2014 By Alan Patrick

McKinsey technology impact on business and Social Business’s role

Busijness Automation

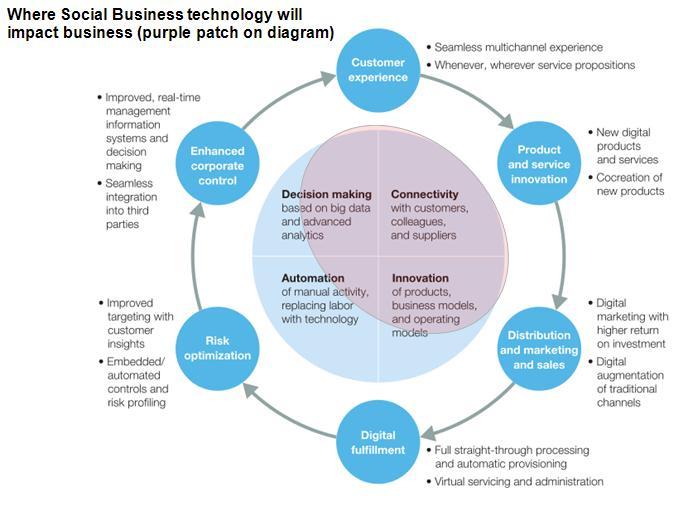
McKinsey has published a model showing the impact of technology on business over the next 5 or so years (diagram above).  They define 4 main areas where technology drives business:

 enhanced connectivity,automation of manual tasks, improved decision making, and product or service innovation . Tools such as big-data analytics, apps, workflow systems, and cloud platforms—all of which enable this value—are too often applied selectively by businesses in narrow pockets of their organization, particularly in sales and marketing.

We have added to this diagram the areas where we think Social Business will mainly impact (the big purple patch on diagram above) – in short:

Enhanced Connectivity – the social network and connectivity, conversational and collaboration tools that Social Media provide will have the major impact on this quadrant. With the availability of it services jacksonville, the reach can also be enhanced.

Improved Decison making – this is partly a function of data analytics (which social tools provide a lot of), but also partly a function of rapid movement of qualitative information and knowledge round an organisation, allowing “hive mind” and “wisdom of criowds” effects to occur. Clearly, social technologies will have a huge impact on this area too, espcially in its ability to move and surface unstructured information. Also, we believe that the really high impact decisions will not be from teh Executive Suite, but from the millions of daily small decisions going right, as information permeates the organisations so large numbers of staff have a proper apprectaion of the situation and can make the correct micro-calls.

Product and Service Innovation – Social tools allow companies to take a much richer view of the market, the competition and their customers, at a far more granular level. By knowing the websites using wordpress, this will drive a far better understanding of where there are problems and opportunities with their products and services. We know from our work that it also makes it far easier to understand and analyse the relative value of making different adaptations. It is also already well known that social technologies are excellent for “crowdsouring” innovation from people outside the organisation, as well as picking up ideas from staff, suppliers and customers

Automation of Manual Tasks – Social tools’ main impact is on automating information flow and message switching. A by product of this is it creates a data “mesh” that can move data around, so reducing “knife and forking”  data from various silo systems into the end to end business flow. Social Business will probably have a lower impact overall here compared to its effect on the other 3 quadrants, but in industries where information automation is the main value driver, it will have a major impact.

There is a kicker in that McKinsey statement though – “platforms—all of which enable this value—are too often applied selectively by businesses in narrow pockets of their organization“. In other words, the real value will be gained when it is implemented end to end. Few systems are as flexible and lightweight to build as end to end systems as social network technologies.

As to the 6 “bubbles” in the diagram – It’s clear that social technologies will have an impact on all of them – impact will vary by industry of course, depending on its structure (see below).  Howver,  I do suspect Social technology’s impact on identifying risks will be surprisingly large if the wisdom of the crowd hive mind and the enhanced “voice of the customer” starts to reduce “group think”

McKinsey claim huge productivity increases from all these technologies:

Digital transformation can make a big difference. To calculate just how big, we examined ten industries: retail banking, mobile telecommunications, airlines, consumer-electronics retailing, apparel, property-and-casualty insurance, hotels, supermarkets, pay-TV broadcasting, and newspaper publishing. …

…On average across the sectors we examined, we found that digital transformation can boost the bottom line by more than 50 percent over the next five years for companies that pull all levers. This ranged from 20 percent in pay-TV broadcasting to more than 200 percent in music retailing, with most sectors clustered in the 30 to 60 percent range. These headline figures are underpinned by a few critical insights: most sectors are expected to double their share of sales coming from digital channels over the next five years. Additionally, digital leaders are on average growing their digital sales at 2.5 times that of their sector peers, with as high as a 9 times multiple seen in newspapers, for instance. Furthermore, we found that companies can, on average, cut the total cost base by 9 percent, resulting in average bottom-line impact of 36 percent, through shifting customer interactions to digital channels and automating paper-heavy processes. This ranged from 3 percent of total costs in grocery retailing to 20 percent in retail banking—substantial impact, which passes directly to the bottom line and reshapes the economics of competition across these sectors.

A certain pinch of salt is required to such projections, execution is always harder than anticipated, but its clearly going to be significant. How much of this will be due to Social Technologies is going to be a major area of discovery over the next 5 years. We’re betting its going to be a major portion.

Share this:

  • Tweet

Filed Under: business innovation, change management, corporate culture, digital disruption, social business, social tools

The Game Theory of Business Socialisation

January 28, 2014 By Alan Patrick

The Game Theory of Business Socialisation

Article in the MIT/Sloan review, about an interesting application of the Prisoner’s Dilemma game in the HBR Review, by a Stanford psychologist (talk about Ivy League linking…) Lee Ross and his colleagues:

Ross conducted a classic “prisoner’s dilemma” scenario with a group of participants. This scenario is one in which two prisoners each are given, separately, the options of cooperating with one another by staying silent, or betraying the other prisoner for a chance at freedom. The catch is that the benefit (or cost) of betrayal versus cooperation is determined by the choice of the other prisoner — that is, whether one prisoner’s choice is better or worse for his situation depends entirely on what action his counterpart takes.

The twist to this scenario was that the researchers told participants in one group that they were playing “the Wall Street Game” and in the other group were told that they were playing “the Community Game.”

The results were striking. When participants were told that they were playing the Wall Street Game, 70% of participants acted according to rational self-interest and chose to betray the other prisoner. When participants were told that they were playing the Community Game, however, 70% of participants chose to cooperate. The key takeaway is that a substantial portion of people decide whether or not to cooperate based on environmental conditions.

As the MIT blog points out, this has some interesting implications for Social Business meeting Corporate Culture:

The implications for how (and with whom) to deploy social business are profound. Companies that already exhibit the cooperative culture of the Community Game will benefit more readily from social business. Social business tools unlock the inherent willingness to collaborate and desire to cooperate embedded in the organizational culture. At the risk of putting too fine of a point on it, social business is the Community Game, where benefits accrue from cooperation and sharing information.

As MIT also points out, enterprises that exhibit the self-interested culture of the Wall Street game, however, may require a cultural shift before they can benefit similarly…and that this cannot be faked (a point we make in our 7S model of social business too). What this means for Social Business in agressive business cultures like investment banking is an interesting thought, if it – as we believe it will – proves to be a more efficient way of doing business.


Share this:

  • Tweet

Filed Under: collaboration

Deloitte on driving social business transformation

January 23, 2014 By Alan Patrick

Deloitte on driving social business transformation

Deloitte Social Flow

The Social Business Flow as seen by Deloitte

Article by Deloitte on driving Social Business transformation:

Social media technologies strip away the hierarchy and bureaucracy long associated with industrialization, replacing them with an open forum of ideas and problem-solving.  When applied strategically to business processes, these tools can draw out the best ideas and efforts from employees spanning all functions of the enterprise.  In fact, anecdotal evidence and research findings reveal that implementing appropriate social technologies and processes has helped some companies boost overall enterprise productivity and increase revenue.

We always like it when people agree with us 🙂

The article is also interesting in that it covers some of the hard work required:

While valuable connections and discoveries may appear to happen serendipitously across social media, realizing the potential of social re-engineering doesn’t happen by accident.  It takes place over time, with purposeful effort.

Well worth a read, some good diagrams as well, the flow diagram (see above) is interesting – not the same as ours, but not dissimilar.

Share this:

  • Tweet

Filed Under: agile business, hierarchies, leadership, social business, social tools, strategy Tagged With: bureaucracy, research, serendipity, transformation, value

Dunbar’s Numbers and Organising for Social Business

January 21, 2014 By Alan Patrick

Dunbar’s Numbers and Organising for Social Business

Dunbar’s  Number – a recap.

Robin Dunbar predicted that c 150 people demarcated the boundary of the number of personalised relationships we can have (Dunbar’s Number), by estimating when the amount of time required to keep a personal relationship going (the “transaction cost” of a personal relationship if you like) hits the wall of time available.  This number varies, some argue that it’s nearly double that of 150, but it’s of this approximate order of magnitude (and we suspect situation dependent on the transaction cost of keeping any one relationship going).  To précis Wikipedia:

Dunbar’s surveys of village and tribe sizes appeared to approximate his predicted value, including 150 as the estimated size of a Neolithic farming village; 150 as the splitting point of Hutterite settlements; 200 as the upper bound on the number of academics in a discipline’s sub-specialization; 150 as the basic unit size of professional armies in Roman antiquity and in modern times since the 16th century; and notions of appropriate company size (in pre-conglomerate days).

There are in fact a number of Dunbar’s Numbers

Dunbar actually theorizes there are a number of Dunbar Numbers, based on a series of boundary levels of social intimacy and acquaintance.  These levels reflect familiarity and emotional closeness, and each level has its own “cognitive constraints on sociality” (loosely speaking, how much you can constantly know about the people in the group).  His work came from looking at group sizes of hunter gatherer societies, past and present.  The levels he defines are broadly:

  • Core group – up to 5 people (family)
  • Close Group – c 15 people (close kinship group)
  • Acquaintance Group – c 50 people (band of related close kin groups)
  • Personal Social Group – c 150 people (bands of common lineage – typical size of a human small village through the ages, and what Dunbar believes is the biggest group of people one Human can have close personal relationships with)
  • Clan or similar organisational entity – c 450-500 people (cohesive sub tribal unit)
  • Tribal Group – c 1500 – 2000 people (a tribe)

Dunbar notes a geometric progression, “a factor of 3” applies to these larger and larger (but increasingly less intimate) social structures.  He was  looking mainly at fairly primitive human social structures, but he also believes that these group sizes have impacts on how we structure organisations and social network technology.

The Dunbar Number of 150 is not cast in stone, but forged in fire

Dunbar argues that 150 would be the mean group size only for communities with a very high incentive to remain together.  For a group of this size to remain cohesive, Dunbar speculated that as much as 42% of the group’s time would have to be devoted to social grooming.  Thus, only groups under intense survival pressure such as subsistence villages, nomadic tribes, and historical military groupings, have, on average, achieved the 150-member mark.  Moreover, Dunbar noted that such groups are almost always physically close: “… we might expect the upper limit on group size to depend on the degree of social dispersal.  In dispersed societies, individuals will meet less often and will thus be less familiar with each other, so group sizes should be smaller in consequence.”  Thus, the 150-member group would occur only because of absolute necessity—due to intense environmental and economic pressures.

Military Dunbar Numbers

Dunbar was not the only person to have made the observations of a “number of numbers” – others have noted for example that from ancient times onwards, armies have structured themselves in very similar sizes – look at modern infantry forces vs ancient ones:

  • c 5 troops – Fire team
  • c 10 – 15 men – Squad (Roman – 8 man, Greek File – 8 to 16 men)
  • c 30 – 40 men – Platoon (The basic Greek unit was 32 – 36 men, the basic Roman unit, the Century, was 60 – 80 men –  double the size – but was essentially split into two half centuries for command purposes)
  • c 120 – 150 men – Company (The Dunbar Number unit.  The Spartans used a 144 man basic formation, the Roman “Century” was 60-80 men but these were normally combined into pairs  (120 – 160 man Maniples)  in action)
  • c 450 – 600 men – Battalion (This size has been a standard size of the largest cohesive fighting formation from the earliest times, the Greek unit was 512 men, the main Roman unit (Cohort, Ala etc) stayed at roughly c 500 men size well into Byzantine times, a 2000 year stretch)
  • c 1500 – 2000 men – (3 – 4  Battalions) – a Regiment or Brigade in modern times – the largest Greek unit was c 1500 – 2000 men.  Roman Legions were c 5000 men, but interestingly the later Roman army split this down to Legiones of c 1,200 (c 2 as increasing responsiveness was required)

These basic structures have lasted thousands of years, under extremely testing conditions.  There is a lesson there.

There is another lesson from military structures too.  Over the period of the Industrial Revolution, as companies grew they needed to be larger, and needed larger structure models.  Business organisations were largely copied off contemporary  structured organisations of the 19th century, the hierarchical military of the time being foremost.  But no sooner was this done, than military organisation started to change.  The last 100 years has seen the pushing of command initiative down to smaller and smaller units.  The lesson came from the highly flexible Commandoes of the South African Boer armies,  but an eventual British victory meant it was swept under the carpet, and the big lesson of the war – that c 75,000 fast moving civilian farmers, in small units,  could only be beaten by half a million professional British Empire troops and guns – was ignored.  The first few years of the First World War showed the inflexible European tactics in all their stupidity, but from 1917 increasingly the initiative was being passed down from battalion to company level as new smaller unit tactics emerged.  This trend continued again into World War 2, which saw the arrival of smaller, independent and highly flexible structures like the Long Range Desert Group, Special Air Service, Marine Commandoes and Chindits.  By the end of World War 2 most armies were using highly flexible, high initiative small formations.  The many post WW2 asymmetric wars in the difficult terrains of Indo China, Africa and the Middle East showed that initiative and leadership had to go down even farther, until  units of 4 men were used as viable independent units.  A lot of this pressure has been forced by the need to react ever faster with fewer resources, and has been facilitated by more and more advanced communications technology.

That last sentence could describe the requirements of business, but what is ironic is that business organisations copied the armies of the wars of the early 1800s a and have been very slow to change, while military organisation has transformed radically.

Dunbar Numbers and Business Organisations

Dunbar also believes the “Dunbar numbers” have major impacts on Organisation design and structures, and on Social Network effectiveness.  Many others have noticed the same effect in organisation structures over the last century of course, a quick look at some bench research throws up the following lessons:

  • c 5 people – Agile software Task teams Team, Customer service cells, Work Cells from Japanese Lean Production experience – the optimum size to get stuff done where everyone can largely cover everyone else. Most businesses are between 1 and 5 people in nearly all countries
  • c 10 – 15 people – most Business Work Groups, Quality Circles, Delphi Technique groups all sit in this size band. Enough people to get sufficiently broad traction on a specific task, not too many to grind it down.
  • c 50 people – The largest group size where one person can know nearly everything that is going on in the group, and the group can collaborate with only a simple (or minimal) leadership hierarchy, run on a real time basis by one person or a small cadre.  Percy Barnevik of Asea Braun Boveri restructured a 200,000 person company into about 5000 units of c 40 people.   Richard Branson of Virgin thinks c 60 people is the right size for a team to remain flexible while still having a broad enough resource base to operate independently.
  • c 150 people – There is quite a lot of empirical support for c 150 people is the largest size at which a business can operate at a personal level, before structure (and silos) replace the  individual touch. Quite a few companies have found that independent units of a few hundred people are the most effective, from Dana Corporation in the 1970s to the Swedish tax office in the ‘Noughties. Many startups find that after about 150 people the company becomes more rigid and loses the initial spirit.  This is also commonly seen as about the largest size a business can get to under the typical “lead from the front” Founder-Entrepreneur team before a layer of meddle-management comes in.
  • c 500 people – Union Pacific restructured itself around units of 500 – 600 people.
  • c 1500 people – Most of the research shows that the larger businesses become increasingly inefficient, ineffective, and downright unpleasant places to work in.  The difficulty in the past is that, for a variety of reasons, forces have pushed businesses to expand to greater than optimum sizes.

The three main reasons that theorists point to, for this growth above optimum sizes, are (dis)economies of scale, transaction costs, and the agency problem.

  • Economies of scale arguments are essentially that even though the per unit efficiency goes down, the total output is still greater and creates lower per unit costs and market advantage. Also, the problems of scale (free riders, poorer communications, bureaucracy and so on) lag growth and so often don’t manifest themselves clearly until some time after the “optimum” size of organisation is surpassed.  A typical example of the diseconomy of scale effect is the Allen Curve, which shows communication in a business decreases exponentially as distance between workers grows
  • Transaction Costs – these are the costs of “getting something done”, first discussed in detail by Ronald Coase in the 1930’s. He noted that people begin to organise their production within firms when the transaction cost of coordinating production through the market exchange, given imperfect information (and high cost of transacting contracts), is greater than within the firm.
  • Agency Theory argues that the easiest thing senior managers (the agents of the business owners) can do to optimise their own reward is grow businesses turnover rather than ensure profitability or value, so they ensure they are rewarded for growth (especially for M&A deals, regardless of the typically negative value created), and thus the business is grown to ensure the rewards are pocketed.

Social Business & Dunbar’s Numbers

As noted, others have come up with similar observations of organisation sizings over the years, but Dunbar gives us a very hard-headed empirical set of metrics and a rationale for why it all works like it does, and that is very useful for understanding the impact of social technologies on business.  In short, we know that:

  • At each Dunbar’s Number level, a new level of social transaction frequency and intimacy is required – it’s not a hard break as a change of state
  • Each of these kevels represents different functional capabilities, from small team workgroup to larger and larger entities with less intimacy but greater sale, reach and flexibility
  • The number limit is set by the amount of social transaction time required to maintain each relationship at that level
  • Social Network technology cannot reduce the amount of time, but reduces the transaction costs of maintain each relationship over digital technology

This allows us to make two hypotheses for Dunbar’s Number in a Social Business world:

Firstly, the technology removes some of the transaction time, so in theory the Dunbar number can grow for any one of these groupings that makes heavy use of digital comms.  That means that a 6 person team is not going to see a huge benefit from social technology, buts a 150 person business spread across multiple locations is more likely to see benefits.  Either it can handle a % more people as well, or the same number of people more richly.  However, the state shift between these groups makes it very unlikely that the technology will allow a 150 person business to have the feel of a 50 person one – more that it can run to say 200 people before losing its 150 level Dunbar status.

Secondly, the transaction cost change makes it easier to keep up with people at a distance, as there is less “hassle” in dealing with them.  The Allen Curve showed that intimacy tends to drop with distance, even using technology – but that was before the current crop of “ambient presence” services.

We hypothesize that the current technologies will make it easier to integrate people working more remotely from each other.  It’s not a replacement for human face time – the increase in bandwidth between digital and face to face communication is orders of magnitude, not a linear increase – but it will make enough of a difference to allow market information, knowledge and decisions to flow through the organisation better than at the competition, which will make the enterprise faster and more likely to ” get it right” – and that, over several cycles, will start to create sustainable business advantage.

Update – been thinking about this post  from Janet Parkinson, and coming to the conclusion that if the Social Object is compelling enough, the Allen Curve can be over-ridden and thus the Dunbar Number can possibly be increased even though people are at a physical distance.  This will be the subject of the next post in this vein I think.


Share this:

  • Tweet

Filed Under: HR, social business, social tools, strategy

« Previous Page

Sign up for our regular Agile Elephant Newsletter - news, posts, ideas and more.

My Tweets

From the Agile Elephant Blog

  • The Metaverse doesn’t exist yet, but…
  • Impossible Things get Disruptive
  • Clarity, Cloud, and Culture Change at IBM

What Next?
Take a look around our site, check out our approach, see how we can help, join the conversation on our blog or contact us to find out more.

About Us

Agile Elephant is a new kind of consultancy designed to help companies embrace the new digital culture of social collaboration, sharing and openness that is changing business models and the world of work.

Contact us to find out more!

Our founder's blogs:

broadstuff

@DT on Medium

Technotropolis

Our blog:

The Agile Elephant Blog

Site Log In | Site Log Out

Subscribe to Site RSS

Subscribe to our Blog via Email

Enter your email address to subscribe

Copyright © 2025 ·Streamline Pro Theme · Genesis Framework by StudioPress · WordPress · Log in